
In the lead up to the new Fantasy A-League season, Fox have taken up a suggestion I made last year, published in my winner’s interview from last season (You can read that here). To add scoring metrics that go beyond goal scorers.
The main defensive scoring changes being:
The main defensive scoring changes being:
- For every 8 recoveries by a player: 1 point
- For a total of 8 blocks, clearances or interceptions by a player: 1 point
The wording for these rules is unfortunately clunky. In the case of blocks, clearances and interceptions, we know of course the player doesn’t need an exact total of 8 (rather than 9 or 10), but that’s how it reads. But it does raise the question, if a player gets 16, will they get 2 points?
That’s not clear.
The other thing that is frustrating is the effect that distributions will play on this scoring. If a player gets 8 recoveries, is that really so much better than getting 7? I’m sure there will be plenty of frustrating 7 CBI scores in the game this season. Equally perplexing is the fact that recoveries (R) and clearances, block and interceptions (CBI) are rated equally at 1/8th of a point.
Yet why not give 1 point for every 4 CBI&R so that distributions would at least play a lesser role whilst not complicating the scoring system?
 | Working out how these rule changes will affect the game will give an advantage in the game, by being able to account for the rule change when making your picks. I’ve identified statistically clear and intuitive patterns from the data that allow us to make more informed choices in defence this season. |
-1 for each goal conceded
Firstly, looking at the effects of negative points on each goal conceded rather than for 2 goals conceded we can intuit that naturally it’s going to punish the teams that conceded a lot.
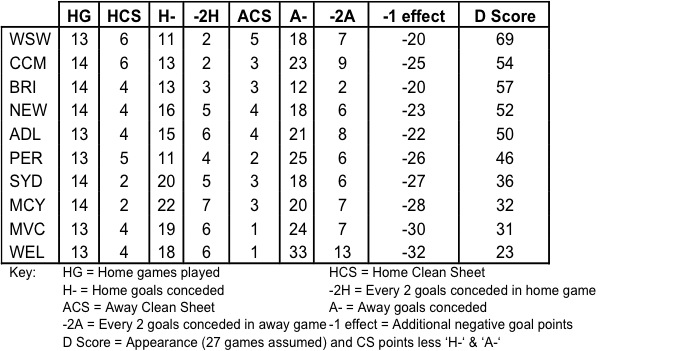
Based on last season’s results, it punishes each team’s defensive players an additional -20 through to -32 through the season, as seen in the -1 effect column in the table below.
The highest total points loss from conceding 2 goals in a match across the season was -19 by Wellington, if the new rules were applied to last season that would have been -51. You can see the effects of this quite clearly in the D score column.
Intuitively the penalties are larger for teams that conceded more goals, who naturally got less clean sheets (CS). The increased penalty for conceding goals will thus increase the divergence in defender scores. Similarly a player will get 4 points for keeping a clean sheet or -1 for conceding 1.
So that is now a 5 point swing, rather than a 4 point swing. Which is why WSW have such a clear lead having kept 2 more CSs than any other team last season.
Here is a summary of the effects of a -1 point loss for every goal conceded over the regular season from last year:
The good thing is that this additional points loss doesn’t completely erode appearance points as seen in the D Score column.
It’s still going to be worthwhile picking up defenders rather than having a non-playing budget filler. The scores are positive even without the benefits of CBI & Recovery bonuses. Defender picks will of course be very important. A player conceding 2 goals with a yellow card (and no additional points) will result in your team losing points, overall playing defenders are better, but some weeks they might not be.
It’s still going to be worthwhile picking up defenders rather than having a non-playing budget filler. The scores are positive even without the benefits of CBI & Recovery bonuses. Defender picks will of course be very important. A player conceding 2 goals with a yellow card (and no additional points) will result in your team losing points, overall playing defenders are better, but some weeks they might not be.
CBI & Recovery Scores
The effects of CBI and Recovery scores are harder to analyse, because there is no publicly available data for CBI & Recoveries for each game.
There is however season cumulative data available which I have gathered. The problem is that with season totals, an average of 8 does not mean the player will get +1 every game. Because the distribution of their CBI might vary, for example:
4 12 4 12 4 12 Average: 8 CBI Points: 3
Player 1
8 8 8 8 8 8 Average: 8 CBI points: 6
Player 2
In the above numerical example, you can see that distribution plays a key role in the CBI points awarded, with the variance of the top example leading to half as many points.
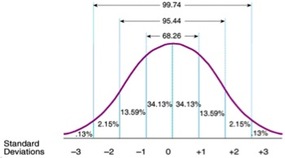
This paragraph details briefly how I’ve estimated the numbers. You don’t need to understand it, but it’s here so that my estimation strategy is transparent. I have assumed a ‘normal distribution’.
Simply, that is that most CBI totals in a game will lie close to the CBI average. I used a standard deviation calculated from a small 5 week sample of defender CBI & Recovery scores from Adelaide in the middle of last season.
The table below shows the estimated CBI & R points and summarises the change to weekly scores caused by the change in rules. Below are the top 20 defenders based on average score per game after the changes. The details of the rest of last year’s players can be found here:
There is however season cumulative data available which I have gathered. The problem is that with season totals, an average of 8 does not mean the player will get +1 every game. Because the distribution of their CBI might vary, for example:
4 12 4 12 4 12 Average: 8 CBI Points: 3
Player 1
8 8 8 8 8 8 Average: 8 CBI points: 6
Player 2
In the above numerical example, you can see that distribution plays a key role in the CBI points awarded, with the variance of the top example leading to half as many points.
This paragraph details briefly how I’ve estimated the numbers. You don’t need to understand it, but it’s here so that my estimation strategy is transparent. I have assumed a ‘normal distribution’.
Simply, that is that most CBI totals in a game will lie close to the CBI average. I used a standard deviation calculated from a small 5 week sample of defender CBI & Recovery scores from Adelaide in the middle of last season.
The table below shows the estimated CBI & R points and summarises the change to weekly scores caused by the change in rules. Below are the top 20 defenders based on average score per game after the changes. The details of the rest of last year’s players can be found here:
Below are the top 20 defenders based on average score per game after the changes. The details of the rest of last year’s players can be found here:
FULL TABLE in Google Docs
FULL TABLE in Google Docs

The ‘Ave Score’ column takes last year’s score, smooths out the clean sheets (Bosnar only got 1 CS in 11 games, compared to 9 in 25 games for the rest of his teammates). Then adds the CBI & R points whilst deducting the additional ‘-1’ points for conceding (weighted to the number of appearances made in the season) and divides all of this by the number of games played. This gives us a fairly accurate idea of what the players weekly score would have been if the rule change was implemented last season.
A thing to note about the above table is the sample size. Ognenovski & Neville only played 10 and 9 games last season, in which they both scored a goal. This 6 points across ~10 games boosts there average score 0.6. Defender goals are notoriously hard to predict and therefore I personally wouldn’t advocate that they are likely to score a goal every 10 games. Similarly Ryall’s 5 goals last season is probably not going to be repeated (let alone the question of whether he starts regularly).
What is clear from the change in rules is that centre backs benefit far more from the CBI & R points as can be seen in the final 2 columns. On average centre backs score 0.7 from CBI & R points weekly, whilst fullbacks get only 0.25. This difference of 0.45 per game over 27 games would lead to 12 more points for a centre back over the season (all other things held constant). Not to mention they tend to be less prone to rotation.
The ‘diff’ column makes it quite clear that most defenders are going to lose points as a result of the rule change. So 3 defenders at the back is likely to remain a popular strategy. But it should also be noted that base prices for defenders increased (from 75k to 100k), whilst the higher prices decreased (highest now 250k, was 300k). So investing in premium defenders is now less costly and with the increased divergence in relative scores they may well be worth investing in.
You’ll also notice the recovery points are minor. That’s because most players will not get to the threshold of 8 recoveries in a game.
There are a few factors missing from this analysis. Yellow cards are partially accounted for using last year’s scores. But not included are the additional points for shots on target and chances created. The bonus from chances created will be very limited for defenders, they rarely get more than 1 chance created per game. Exceptions may turn out during the season, but currently Bojic is the only significant chance creating defender and he only gets a point every 2 games from that (much less than Ognenovski’s point per game from CBI).
Shots on target are also missing from this analysis, but they are more evenly spread between full backs and centre backs, with centre backs benefiting from headers at corners to make up for their more conservative field position.
GoalKeepers
The effects on goalkeepers is reasonably obvious. They don’t benefit from CBI & recoveries and therefore there scores can only go down. Surprisingly, there’s been very little change in the cost of keepers. The base cost for a non-playing keeper went up by 25k to 100k. But other than that there costs are fairly similar. The diversity of scores is reasonably low (teams that concede more goals, also tend to get higher quantities of saves). Therefore Covic, Theo & Galekovic are very unlikely to be worth investing extra funds into.
Here’s a table of the effects of the -1 points loss for each goal conceded on goal keepers:
Here’s a table of the effects of the -1 points loss for each goal conceded on goal keepers:

With about 2-2.5 points per game. The investment of 100k more to get a starting keeper (over a budget filler) will still be worth it.
But certainly don’t bother investing in 2 keepers and of course Young is a prime option for the start of the season whilst Theo is injured.
But certainly don’t bother investing in 2 keepers and of course Young is a prime option for the start of the season whilst Theo is injured.
Conclusion
Therefore in conclusion, my main findings are:
1. Centre back scores will increase relative to Fullbacks due to the addition of CBI and Recovery points. Centre backs on average score 0.45 higher per game
2. Quality defences will score relatively better due to the increased punishment for conceding goals
3. Playing defenders are still worth investing in over budget fillers
4. Keepers average scores will fall, but they are still worth investing in over budget fillers
Any questions? Leave a comment below or find me on Twitter!

 RSS Feed
